| View previous topic :: View next topic
|
| Author |
Message |
Roscoemck
Joined: 10 Aug 2016
Posts: 483
Location: Glasgow
|
 Posted: Fri Dec 08, 2017 1:15 pm Post subject: Training Peaks Posted: Fri Dec 08, 2017 1:15 pm Post subject: Training Peaks |
 |
|
Just got a code for a 7 day trial so naturally signed up 
What a lot of information!
Something that's always baffled me on the free version. Why does it sometimes show run figure of hrTSS, sometimes rTSS?
From this week:
Monday run 0hrTSS
Tuesday bike 28hrTSS
Wednesday run 51rTSS
Thursday bike 27hrTSS
Friday run 0hrTSS
I appreciate to get the most out of even the basic version I'll need to have a look at my zones and set them properly.
Just confused as to the different TSS that shows up.
Having a brief look at the full version, I doubt it would be worth me paying even the discounted amount.
|
|
| Back to top |
|
 |
stenard
Joined: 04 Sep 2013
Posts: 2063
|
|
| Back to top |
|
|
Roscoemck
Joined: 10 Aug 2016
Posts: 483
Location: Glasgow
|
| Posted: Fri Dec 08, 2017 4:00 pm Post subject: |
|
|
| stenard wrote: | | https://help.trainingpeaks.com/hc/en-us/articles/204071944-Training-Stress-Scores-TSS-Explained |
Sooooooo, why would 2 runs have different types of TSS?
I'm sure I read I set my HR Threshold by inputting the Average HR from a recent race, is that correct.
|
|
| Back to top |
|
|
stenard
Joined: 04 Sep 2013
Posts: 2063
|
| Posted: Fri Dec 08, 2017 4:31 pm Post subject: |
|
|
| Roscoemck wrote: | | stenard wrote: | | https://help.trainingpeaks.com/hc/en-us/articles/204071944-Training-Stress-Scores-TSS-Explained |
Sooooooo, why would 2 runs have different types of TSS?
I'm sure I read I set my HR Threshold by inputting the Average HR from a recent race, is that correct. |
Are you wearing a HRM? You clearly are for the bikes, as otherwise it would not be possible to have a hrTSS value, but what about the runs? 0 hrTSS implies not?
If you read what that article says about the TSS metrics, then "rTSS is the second most accurate method of calculating a Training Stress Score, and is the default method for Run workouts when there is enough data present to calculate". This would potentially imply that your runs where rTSS is not showing did not have enough data? Were they super short?
You can also select which TSS is displayed when you click on each workout. There's a "twisty" arrow next to the TSS value and if you click on that you get different numbers when you select the different TSS options.
Taking an easy 60mins run for me last night, as I also have a stryd PM, I get the option of all three TSS values:
TSS - 71
rTSS - 85
hrTSS - 62
Personally, I would only put any weight behind the TSS and hrTSS values. I can't recall having ever set my "pace zones", whereas my HR threshold and my perceived running power FTP are more driven by actual analysis of numbers in appropriate races/test environments. That said, the variability shows that TSS is hard to truly measure accurately. Hence why I don't actually bother paying for premium, just to get the PMC. The one stravistix gives is probably as representative, and free. And ultimately I am paying for a coach to appropriately manage my fitness and fatigue towards my A races.
|
|
| Back to top |
|
|
Roscoemck
Joined: 10 Aug 2016
Posts: 483
Location: Glasgow
|
| Posted: Fri Dec 08, 2017 4:37 pm Post subject: |
|
|
| stenard wrote: | | Roscoemck wrote: | | stenard wrote: | | https://help.trainingpeaks.com/hc/en-us/articles/204071944-Training-Stress-Scores-TSS-Explained |
Sooooooo, why would 2 runs have different types of TSS?
I'm sure I read I set my HR Threshold by inputting the Average HR from a recent race, is that correct. |
Are you wearing a HRM? You clearly are for the bikes, as otherwise it would not be possible to have a hrTSS value, but what about the runs? 0 hrTSS implies not?
If you read what that article says about the TSS metrics, then "rTSS is the second most accurate method of calculating a Training Stress Score, and is the default method for Run workouts when there is enough data present to calculate". This would potentially imply that your runs where rTSS is not showing did not have enough data?
You can also select which TSS is displayed when you click on each workout. There's a "twisty" arrow next to the TSS value and if you click on that you get different numbers when you select the different TSS options.
Taking an easy 60mins run for me last night, as I also have a stryd PM, I get the option of all three TSS values:
TSS - 71
rTSS - 85
hrTSS - 62
Personally, I would only put any weight behind the TSS and hrTSS values. I can't recall having ever set my "pace zones", whereas my HR threshold and my perceived running power FTP are more driven by actual analysis of numbers in appropriate races/test environments. |
Why wouldn't there be enough data I wonder? I always wear a HRM on a run or bike.
|
|
| Back to top |
|
|
stenard
Joined: 04 Sep 2013
Posts: 2063
|
| Posted: Fri Dec 08, 2017 4:44 pm Post subject: |
|
|
| Roscoemck wrote: |
Why wouldn't there be enough data I wonder? I always wear a HRM on a run or bike. |
No idea. Do you actually have HR data on those workouts showing?
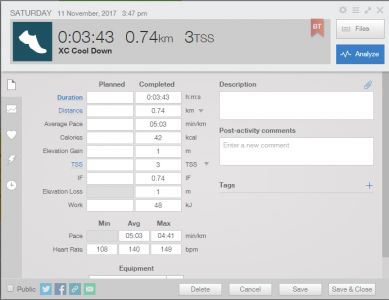
I've just checked a super short run, being a quick cool down after XC the other week, and I get all the TSS/rTSS/hrTSS values for something even this brief an activity.
|
|
| Back to top |
|
|
jibberjim
Joined: 15 Aug 2008
Posts: 8392
Location: Kingston
|
| Posted: Fri Dec 08, 2017 7:04 pm Post subject: |
|
|
missing rTSS is most likely lack of altitude data.
rTSS is astonishingly bad, don't use it. There is too much variation in running that inferring power from speed is not a good idea.
Whilst rTSS takes into account hills - if there's good enough barometric altitude, run a flat route when there's a storm coming - it doesn't take into account wind, surface, shoes, weight etc.
_________________
Jibbering Sports Stuff
|
|
| Back to top |
|
|
Roscoemck
Joined: 10 Aug 2016
Posts: 483
Location: Glasgow
|
| Posted: Fri Dec 08, 2017 8:56 pm Post subject: |
|
|
Hi guys,
It shows the HR values as above, just no TSS.
Why would there be a lack of altitude data? Odd.
|
|
| Back to top |
|
|
Jorgan

Joined: 12 Nov 2007
Posts: 18226
Location: alles was ich bin, alles was ich war
|
| Posted: Mon Oct 01, 2018 2:42 pm Post subject: |
|
|
Okay, so I'm just tinkering with a free account. It's uploaded quite a few few sessions going back to Aug by looks of it, but quite a few are missing. I've not really bothered with TP as I already have a shed loads of accounts, and I'm self coached.
However, I'm interested that the last two weekends when I've taken the Saturday off, my TSB has actually gone up! Any ideas why it's done this?
_________________
27 Years since it all began....
|
|
| Back to top |
|
|
stenard
Joined: 04 Sep 2013
Posts: 2063
|
| Posted: Mon Oct 01, 2018 4:35 pm Post subject: |
|
|
| Jorgan wrote: | Okay, so I'm just tinkering with a free account. It's uploaded quite a few few sessions going back to Aug by looks of it, but quite a few are missing. I've not really bothered with TP as I already have a shed loads of accounts, and I'm self coached.
However, I'm interested that the last two weekends when I've taken the Saturday off, my TSB has actually gone up! Any ideas why it's done this? |
It will always go up on a rest day. TSB is the differential between CTL and ATL. As CTL is the 42 day rolling average TSS, whereas ATL is the 7 day average, a rest day will always have a greater impact on ATL. Therefore, TSB will rise.
It's effectively the goal of taper ... shed the acute fatigue whilst minimising the longer term fitness losses, so that on race day you are fit, but fresh.
As you can see on my PMC, during big blocks of training the TSB (yellow) goes down, as ATL (pink) spikes whilst CTL (blue shaded) climbs more slowly. But during taper, so August onwards into my race, the trend reverses and I hit race day with a significantly positive TSB.

_________________
My blog: https://stenardstuff.wordpress.com/
Random stuff and race reports
|
|
| Back to top |
|
|
stenard
Joined: 04 Sep 2013
Posts: 2063
|
| Posted: Mon Oct 01, 2018 5:20 pm Post subject: |
|
|
It's worth noting that if you want a pretty decent PMC equivalent, then the one on stravistix (a google chrome extension that provides extra data based on your strava activity) is pretty good now. I've validated that it generally follows my TP PMC, at least in broad trends if not precise numbers.
e.g. You can see the ATL and CTL numbers align pretty closely. The TSB is displayed separately below.

_________________
My blog: https://stenardstuff.wordpress.com/
Random stuff and race reports
|
|
| Back to top |
|
|
Jorgan
Joined: 12 Nov 2007
Posts: 18226
Location: alles was ich bin, alles was ich war
|
| Posted: Tue Oct 02, 2018 8:08 am Post subject: |
|
|
It's going to take me a while to get my head around how they do stuff; if I keep it steady this week, my TSB should only be -2 for my Sprint Tri on Sunday!
My Cold is clouding things a little at the moment, but I use RHR and my own experience of doing this for 20-odd years a lot to gauge my recovery and general health - in fact probably more so now I have a watch with OHR. I old skool init. It will be interesting to see how TP and my own experiences work together.
_________________
27 Years since it all began....
|
|
| Back to top |
|
|
PCP

Joined: 13 Oct 2012
Posts: 2005
Location: Manchester
|
| Posted: Tue Oct 02, 2018 8:24 am Post subject: |
|
|
| stenard wrote: |
As you can see on my PMC, during big blocks of training the TSB (yellow) goes down, as ATL (pink) spikes whilst CTL (blue shaded) climbs more slowly. But during taper, so August onwards into my race, the trend reverses and I hit race day with a significantly positive TSB. |
My eyes can't quite see but am I right in thinking you peaked at 110 CTL then tapered to 100? And this was your recent sub 10 effort?
|
|
| Back to top |
|
|
Buzz_
Joined: 19 May 2007
Posts: 453
|
| Posted: Tue Oct 02, 2018 8:42 am Post subject: |
|
|
| Jorgan wrote: | It's going to take me a while to get my head around how they do stuff; if I keep it steady this week, my TSB should only be -2 for my Sprint Tri on Sunday!
My Cold is clouding things a little at the moment, but I use RHR and my own experience of doing this for 20-odd years a lot to gauge my recovery and general health - in fact probably more so now I have a watch with OHR. I old skool init. It will be interesting to see how TP and my own experiences work together. |
You have to remember that TSS is training stress score and not Life Stress Score. Illness, lack of sleep, kids birthday parties are going to impact recovery. RHR will show this where TSS will not.
|
|
| Back to top |
|
|
stenard
Joined: 04 Sep 2013
Posts: 2063
|
| Posted: Tue Oct 02, 2018 8:42 am Post subject: |
|
|
| PCP wrote: | | stenard wrote: |
As you can see on my PMC, during big blocks of training the TSB (yellow) goes down, as ATL (pink) spikes whilst CTL (blue shaded) climbs more slowly. But during taper, so August onwards into my race, the trend reverses and I hit race day with a significantly positive TSB. |
My eyes can't quite see but am I right in thinking you peaked at 110 CTL then tapered to 100? And this was your recent sub 10 effort? |
Yeah, not the best of hosted images. Checking, that solid line is 125. I peaked at 126 (3 weeks out from the race) and was 104 the day before race day (per the training peaks numbers). Yes, that was the recent sub10.
_________________
My blog: https://stenardstuff.wordpress.com/
Random stuff and race reports
|
|
| Back to top |
|
|
|